
Last Updated on July 18, 2023
Short Answer
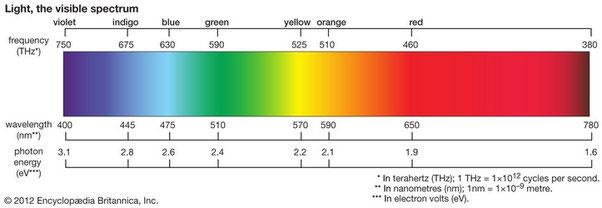
The frequency corresponding to an absorption line at 460 nm can be calculated using the formula: frequency = speed of light/Wavelength. The rate of light is approximately 3 x 10^8 meters per second. To convert the Wavelength from nm to meters, we divide by 10^9. Therefore, the frequency can be calculated as follows: frequency = (3 x 10^8) / (460 x 10^-9) = 6.52 x 10^14 Hz. So, the frequency corresponding to an absorption line at 460 nm is approximately 6.52 x 10^14 Hz.
Understanding the concept of absorption lines and their relationship to frequency is crucial in spectroscopy. Absorption lines are dark lines that appear in a spectrum when light passes through a medium, and specific wavelengths are absorbed by the atoms or molecules in that medium. These lines provide valuable information about the composition and properties of the medium. Absorption spectroscopy is a technique used to study these lines and analyze the substances in a sample. Scientists can determine the chemical elements or compounds present by identifying the specific frequencies at which absorption lines occur. In this article, we will explore the basics of absorption spectroscopy and delve into the factors that influence the frequency of absorption lines. Additionally, we will learn how to calculate the frequency corresponding to an absorption line at 460 nm and discuss the importance of accurate frequency determination in absorption spectroscopy.
Exploring the basics of absorption spectroscopy
In this section, we will delve into the fundamentals of absorption spectroscopy and its relevance in scientific research. Here are some key points to consider:
- Absorption spectroscopy is a technique used to study the interaction between electromagnetic radiation and matter.
- It involves measuring the amount of light absorbed by a sample at different wavelengths.
- Absorption lines are specific wavelengths at which the sample absorbs light.
- These absorption lines are unique to each chemical element, making them useful for identification.
- The frequency of an absorption line corresponds to the energy difference between two energy levels in the atom or molecule.
Understanding the basics of absorption spectroscopy is crucial for comprehending the concept of absorption lines and their relationship to frequency. In the next section, we will explore the significance of absorption lines in identifying chemical elements.
The significance of absorption lines in identifying chemical elements
Absorption lines play a crucial role in determining chemical elements in various substances. When light passes through a sample, specific wavelengths are absorbed by the atoms or molecules in a sense. These absorbed wavelengths correspond to the atoms’ or molecules’ specific energy levels, creating dark lines in the spectrum.
Identifying these absorption lines allows scientists to determine the chemical composition of a substance. Each element has a unique set of energy levels, resulting in distinct absorption lines. Scientists can identify the elements present in the substance by comparing the absorption lines observed in a sample to a database of known absorption lines.
This information is invaluable in astronomy, chemistry, and forensics fields. In astronomy, absorption lines in the spectra of stars and galaxies provide insights into their composition and physical properties. In chemistry, absorption spectroscopy is used to analyze the design of compounds and study chemical reactions. In forensics, absorption spectroscopy helps identify substances found at crime scenes.
The Role of Wavelength and Frequency in absorption spectroscopy
Wavelength and frequency are fundamental concepts in absorption spectroscopy. Wavelength refers to the distance between two consecutive peaks or troughs of a wave, while frequency represents the number of wave cycles that pass a given point in one second.
In absorption spectroscopy, the Wavelength of the absorbed light determines the energy levels of the atoms or molecules. Each element has specific energy levels, and when light with the corresponding Wavelength is absorbed, it causes transitions between these energy levels. This absorption results in the formation of absorption lines in the spectrum.
The frequency of the absorbed light is directly related to the energy of the absorbed photons. Higher-frequency light carries more energy, while lower-frequency light carries less significance. Scientists can determine the power associated with the absorption line by calculating the frequency corresponding to a given wavelength.
Understanding the relationship between Wavelength, frequency, and absorption lines is essential for accurate analysis and interpretation of absorption spectra. It allows scientists to identify the chemical elements present in a substance and gain insights into its properties and behavior.
Factors influencing the frequency of absorption lines
When studying absorption lines in spectroscopy, it is essential to consider the various factors affecting their frequency. These factors are crucial in determining the specific Wavelength at which an absorption line occurs.
One of the primary factors is the nature of the absorbing material. Different elements and compounds have unique electronic structures, which result in specific energy levels and transitions. These transitions correspond to absorption lines at particular frequencies.
Another factor is the temperature of the absorbing material. As temperature increases, the atoms or molecules within the material gain more energy, broadening the absorption lines. This broadening effect can make it more challenging to accurately determine a specific absorption line’s frequency.
The pressure and density of the absorbing material can also impact the frequency of absorption lines. Higher pressures and densities can cause shifts in the energy levels, resulting in a change in the frequency at which absorption occurs.
Overall, understanding the factors that influence the frequency of absorption lines is essential for accurately interpreting spectroscopic data and identifying the chemical elements present in a sample.
How to calculate the frequency corresponding to an absorption line at 460 nm
Calculating the frequency corresponding to an absorption line at 460 nm involves understanding the relationship between Wavelength and frequency. Here are the steps to calculate the frequency:
- Convert the Wavelength from nanometers (nm) to meters (m). In this case, 460 nm is equal to 460 x 10^-9 meters.
- Use the formula: speed of light = wavelength x frequency. Rearrange the formula to solve for frequency: frequency = rate of light/Wavelength.
- Substitute the values into the formula. The speed of light is approximately 3 x 10^8 meters per second.
- Calculate the frequency by dividing the speed of light by the Wavelength in meters. In this case, the frequency would be approximately 6.52 x 10^14 Hz.
Following these steps, you can determine the frequency corresponding to an absorption line at 460 nm. It is important to note that this calculation assumes the absorption line is in a vacuum and unaffected by other factors.
The Role of Wavelength and frequency absorption spectroscopy
In absorption spectroscopy, the interaction between light and matter is crucial for understanding the properties of substances. Wavelength and frequency play a significant role in this process. Here are some key points to consider:
- Wavelength: Wavelength refers to the distance between two consecutive peaks or troughs of a wave. It is usually measured in nanometers (nm) or meters (m). In absorption spectroscopy, the Wavelength of light determines the color or energy of the light absorbed by a substance.
- Frequency: On the other hand, frequency refers to the number of wave cycles that pass a given point in one second. It is measured in hertz (Hz) or cycles per second. In absorption spectroscopy, the frequency of light determines the energy of the light being absorbed by a substance.
- Relationship between Wavelength and frequency: The Wavelength and frequency of light are inversely proportional. This means that as the Wavelength increases, the frequency decreases, and vice versa. The equation describes this relationship: speed of light = wavelength x frequency.
- Absorption lines: Absorption lines are specific light wavelengths that a substance absorbs. These lines appear as dark bands in a spectrum when the substance absorbs light at those particular wavelengths.
- Corresponding frequency: To calculate the frequency corresponding to an absorption line at 460 nm, we can use the equation: frequency = speed of light/Wavelength. By substituting the values, we can determine the frequency of absorption.
Understanding the role of Wavelength and frequency in absorption spectroscopy is essential for accurately identifying substances and analyzing their properties. By studying absorption lines and their corresponding frequencies, scientists can gain valuable insights into the composition and behavior of various materials.
Typical applications of absorption spectroscopy in various fields
Absorption spectroscopy is a versatile technique that finds applications in various fields. One of the most common applications is in the field of chemistry, where it is used to identify and analyze chemical compounds. By measuring the absorption spectrum of a sample, scientists can determine the presence and concentration of different elements or molecules.
In environmental science, absorption spectroscopy monitors air and water quality. It can detect pollutants and contaminants, helping assess human activities impact on the environment.
Another important application is in the pharmaceutical industry, where absorption spectroscopy is used to analyze the purity and concentration of drugs. Forensic science also uses it to identify substances found at crime scenes.
Furthermore, absorption spectroscopy has applications in astronomy, which is used to study the composition of celestial objects. BAstronomers can gain insights into their chemical makeup and physical properties by analyzing the absorption lines in the light emitted by stars and galaxies,
Absorption spectroscopy is a powerful tool with numerous applications across various scientific disciplines. Its ability to provide valuable information about the composition and properties of substances makes it an indispensable technique in research and analysis.
Techniques for measuring absorption lines and determining their frequencies
Measuring absorption lines and determining their frequencies is a crucial aspect of absorption spectroscopy. There are several techniques that scientists use to accomplish this task.
Spectrophotometry
Spectrophotometry is a widely used technique for measuring absorption lines. It involves passing a beam of light through a sample and measuring the intensity of the transmitted light. By comparing the power of the transmitted light to the power of the incident light, scientists can determine the amount of light absorbed by the sample and calculate the frequency of the absorption line.
Atomic absorption spectroscopy
Atomic absorption spectroscopy is another technique used to measure absorption lines. It involves using a flame or a graphite furnace to atomize the sample and then pass a beam of light through the piece. The absorbed light is then measured, and the frequency of the absorption line can be determined.
Laser absorption spectroscopy
Laser absorption spectroscopy is a more advanced technique that utilizes lasers to measure absorption lines. It offers high sensitivity and selectivity, making it suitable for analyzing trace amounts of substances. By tuning the laser to the specific frequency of the absorption line, scientists can accurately determine its frequency.
These techniques and others play a crucial role in accurately measuring absorption lines and determining their frequencies. They enable scientists to gain valuable insights into the composition and properties of various substances, contributing to advancements in chemistry, physics, and environmental science.
The importance of accurate frequency determination in absorption spectroscopy
In absorption spectroscopy, accurate frequency determination is crucial for understanding the properties of various substances. Absorption lines, which are specific wavelengths at which a sense absorbs light, provide valuable information about the composition and structure of molecules. By accurately determining the frequency of absorption lines, scientists can identify the chemical elements present in a sample and gain insights into their behavior.
Accurate frequency determination is essential for several reasons. Firstly, it allows scientists to compare absorption spectra from different sources and analyze the similarities and differences. This helps in identifying unknown substances and studying their properties. Secondly, accurate frequency determination enables the precise measurement of absorption intensities, which can provide information about the concentration of a substance in a sample.
Furthermore, accurate frequency determination is crucial for developing new technologies and applications. For example, absorption spectroscopy is used in medicine for diagnosing diseases and monitoring drug concentrations in the body. Accurate frequency determination ensures the reliability and effectiveness of these techniques.
In conclusion, accurate frequency determination plays a vital role in absorption spectroscopy. It enables scientists to identify chemical elements, study their properties, and develop new applications. Therefore, it is essential to use precise measurement techniques and calculations to ensure the accuracy of frequency determination in absorption spectroscopy.
Expanding our understanding of absorption lines and their corresponding frequencies
This article delves into the intricate world of absorption lines and their relationship to frequency. We have explored the basics of absorption spectroscopy and its significance in identifying chemical elements. Additionally, we have discussed the various factors that influence the frequency of absorption lines.
We have focused on calculating the frequency corresponding to an absorption line at 460 nm. By understanding the role of Wavelength and frequency in absorption spectroscopy, we can accurately determine the frequencies of absorption lines.
Furthermore, we have highlighted the typical applications of absorption spectroscopy in various fields and the techniques used to measure absorption lines and determine their frequencies. Accurate frequency determination is of utmost importance in absorption spectroscopy.
Enhancing our knowledge of absorption lines and their corresponding frequencies can further advance our understanding of the chemical world. This knowledge has far-reaching implications in chemistry, physics, and environmental science. As we continue to explore this fascinating subject, we unlock new possibilities for scientific discovery and innovation.
Frequently Asked Questions
What are absorption lines, and how are they related to frequency?
Absorption lines are dark lines that appear in a spectrum when light passes through a medium, and specific wavelengths are absorbed by the atoms or molecules in that medium. The frequency of an absorption line corresponds to the particular energy level transition of the absorbing species.
What is absorption spectroscopy?
Absorption spectroscopy is a technique used to study the interaction between light and matter. It involves measuring the amount of light absorbed by a sample at different wavelengths, which provides information about the composition and properties of the piece.
Why are absorption lines significant in identifying chemical elements?
Each chemical element has a unique set of energy levels and, therefore, a unique pattern of absorption lines. By analyzing the absorption lines in a spectrum, scientists can identify the presence of specific elements in a sample.
What factors influence the frequency of absorption lines?
The frequency of absorption lines is influenced by several factors, including the energy levels of the absorbing species, the nature of the medium through which the light passes, and the physical conditions of the system.
How can I calculate the frequency corresponding to an absorption line at 460 nm?
To calculate the frequency corresponding to an absorption line at 460 nm, you can use the equation: frequency = speed of light/Wavelength. The rate of light is approximately 3.00 x 10^8 meters per second.
What is the role of Wavelength and frequency in absorption spectroscopy?
Wavelength and frequency are inversely related in absorption spectroscopy. As the Wavelength of light decreases, the frequency increases, and vice versa. This relationship is essential for understanding the behavior of absorption lines.
What are some typical applications of absorption spectroscopy?
Absorption spectroscopy has a wide range of applications in various fields. It is used in environmental monitoring, pharmaceutical analysis, forensic science, the food and beverage industry, and many other areas where the identification and quantification of substances are essential.
What techniques are used for measuring absorption lines and determining their frequencies?
Several techniques are used to measure absorption lines and determine their frequencies, including UV-Vis, infrared, and atomic absorption spectroscopy. These techniques involve passing light through a sample and analyzing the absorption spectrum.
Why is accurate frequency determination important in absorption spectroscopy?
Accurate frequency determination is crucial in absorption spectroscopy because it allows for precise identification and quantification of the absorbing species. It ensures reliable and meaningful results in various scientific and analytical applications.
How does enhancing our knowledge of absorption lines and their corresponding frequencies benefit us?
Enhancing our knowledge of absorption lines and their corresponding frequencies enables us to understand better the behavior of matter and the interactions between light and atoms or molecules. This knowledge has practical applications in various scientific fields and contributes to advancements in technology and research.
About The Author

Pat Rowse is a thinker. He loves delving into Twitter to find the latest scholarly debates and then analyzing them from every possible perspective. He's an introvert who really enjoys spending time alone reading about history and influential people. Pat also has a deep love of the internet and all things digital; she considers himself an amateur internet maven. When he's not buried in a book or online, he can be found hardcore analyzing anything and everything that comes his way.